Compliance

Can ANSI/ASSP Z16.1 help you move your safety program forward?
By ASSP
Video credit: Sean Anthony Eddy / Vetta via Getty Images
T
he way many leaders measure safety program effectiveness is changing.
Although total recordable incident rate (TRIR) has been used for nearly 50 years, organizations are starting to recognize the limitations of incident rates and other failure metrics. ANSI/ASSP Z16.1, a new voluntary consensus standard, offers safety professionals a better way to measure and communicate results.
“Z16 is a game changer,” says Pam Walaski, CSP, FASSP, senior program director of Specialty Technical Consultants Inc. and ASSP’s senior vice president. Walaski shared her insights during a recent webinar hosted by ASSP’s Consultants, Management and Risk Management Practice Specialty communities.
“What we have been doing is ineffective and probably isn’t correct,” she says. “Z16 provides a path forward and is a critical juncture for the profession.”
Developed by the ANSI/ASSP Z16 Committee on Safety and Health Metrics and Performance Measures, the standard addresses leading, lagging and impact safety metrics. It calls for practitioners to develop sets of these three metrics for the two parts of the standard: risk management and management systems improvement.
What’s wrong with how we measure safety now?
Although TRIR remains one of the most common measures of safety performance in the U.S., research indicates its results are too random to be statistically significant, particularly when benchmarking a safety program. Walaski highlights several key points reported in “The Statistical Invalidity of TRIR as a Measure of Safety Performance,” an April 2021 Professional Safety article that took a deep look at why these metrics fail safety professionals and their orgainzations:
Lagging incident rates don’t measure how well a safety program functions.
OSHA’s recordkeeping standard, on which many safety programs are based, was not intended to measure progress. It was created to track information and enforcement.
Current metrics are isolated from business operations and don’t provide information on the value of a company’s investment in safety.
Additionally, Walaski notes in her August 2020 Professional Safety article, “The Role of Leading and Lagging Indicators in OSH Performance Management,” that there is no consistent definition or use of terms such as metric, indicator, lagging or leading.
Why Is ANSI/ASSP Z16.1 game-changer?
The Z16 standard addresses many of the issues safety professionals and their organizations face when creating clear and compelling metrics that indicate the real value of workplace safety programs. Here’s why:
Z16 carries the credibility of the consensus standard process. A committee of relevant subject matter experts and key stakeholders, balanced so it doesn’t favor one perspective, came together to write the standard, then completed a well-regarded consensus process to publish the document. Unlike OSHA regulations, consensus standards must be regularly reviewed and revised every five years.
The standard contains clear definitions and outlines iterative processes.
It highlights the business outcomes of safety and health programs and processes through the impact metric.
It underscores the importance of a balanced approach.
How does Z16 define metrics?
Z16 uses the term metric instead of indicator because it is more multi-dimensional, Walaski says. A metric is a quantifiable measure that an organization uses to track and assess the status of a specific process, compared to a single-focus indicator that documents an individual tally of a completed activity.
To be a credible safety yardstick, Walaski says a metric must:
Be accurate, comparable, reproducible, meaningful and relevant
Drive the actions needed to achieve the objectives
Be clearly understood and actionable
Not create unintended or unanticipated consequences, such as underreporting
While safety professionals must maintain injury- or incident-based records and indicators, they should start to move away from them as a measure of program performance, Walaski says.
“Businesses don’t measure themselves by the lack of something,” she points out. “The CFO’s metric for 2022 isn’t, ‘Don’t lose money.’ If we continue to use those (injury- and incident-based metrics), we continue that disconnect with our senior leadership. That’s why the impact metrics in Z16 provide a great pathway to tie safety to the organization.”
The standard’s use of lagging and leading metrics in alignment with the new impact metrics is one feature that makes the standard so useful.
The impact metrics described in Z16 demonstrate s how safety- and health-related programs, policies and activities affect an organization. They answer these questions: How does the investment made in these programs benefit the organization? What happens when we are successful?
What Is the balanced metrics approach?
The Z16 balanced metrics approach considers the interrelationship between risk reduction and the continual improvement of the management system. Safety professionals must include:
One balanced set risk management metrics and one set safety and health management system improvement metric and ideally they should be interrealted.
Leading, lagging and impact metrics that provide an understanding of inputs, outputs, outcomes and their organizational impact
To develop the proper metrics, follow this step-by-step process:
1. Define what you want to do with risk management. The goal is always to reduce risk in your organization, Walaski says, so start by identifying candidates for risk reduction and prioritize them based on the greatest improvement potential. She recommends using one of these methods:
Risk assessments: High severity/likelihood, greatest loss potential
Loss analyses: Inspections, incidents, audits, workers’ compensation information provided by insurance company
Hazard/control evaluations: nonconformities, low-level controls used
2. Develop risk reduction metrics. Select leading, lagging and impact metrics by following these three steps:
Determine what you’re trying to achieve as a result of this particular metric (lagging).
Assess how you can influence the results (leading).
Consider the anticipated effect on organizational strategy (impact).
Table 1 in the standard shares some risk management elements and attributes and explains how to tie them to the right metrics.
3. Define how you want to improve your management system. To achieve the balanced approach, make sure the risk reduction metrics align with the management system metrics. Look for management system elements that would be affected by or balanced with the success of your risk management metrics.
To find these elements:
Conduct a gap analysis of safety and health management system elements, such as leadership, support, monitoring and continual improvement.
Compare the identified gaps to your organization’s strategic objectives or industry benchmarking
Table 2 in the standard shares some of these elements and attributes and explains how to tie them to the right metrics.

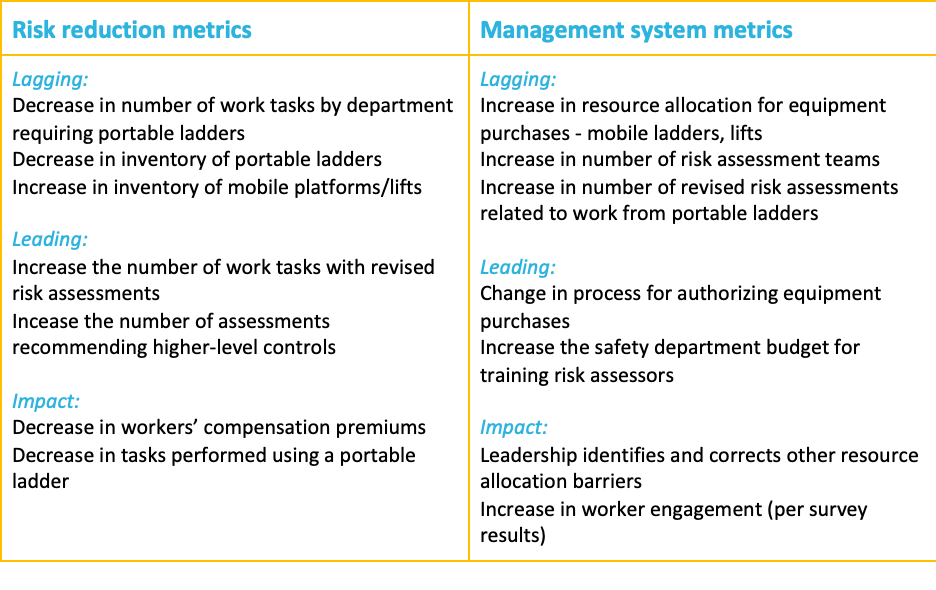
Example: Designing fall prevention metrics using the balanced metrics approach
To fully demonstrate how this new approach will work, Walaski shares a fall prevention example.
Here’s the scenario: A company has experienced many falls from portable ladders. While none of the incidents have been fatal, many have caused serious injury.
Currently completed risk assessments demonstrate the potential for high severity outcomes. Workers’ compensation loss runs indicate multiple injuries from working on portable ladders. In addition, the curent inventory of ladders are old and are not in good condition. All of these factors present significant opportunities to reduce risk.
One way to reduce risk is to minimize the use of portable ladders, use mobile platforms/lifts and redesign work tasks so there is less work requiring the use of ladders.
By following Z16 and the balanced approach process, these metrics are selected to evaluate this program:
How do I get started with Z16?
“For many organizations, this is going to take years, so it’s important you prepare for a long transition,” Walaski says. She offers five steps for getting started:
2. Form a transition team. Make sure all levels and groups are represented organization-wide.
3. Plan for the transition by emphasizing new approaches. Because organizations have used TRIR for so long, simply taking it away may cause credibility issues and confusion. Instead, Walaski recommends desocializing and deemphasizing those metrics while you push the new approach.
4. Develop consensus on the top five risks. Using that list, set priorities for reducing those risks with this new process, then conduct a management system gap analysis.
5. Take baby steps. Start with a pilot program, then ask the transition team to assess what worked, what didn’t and ways to make the next program more comprehensive.
ASSP is a global association for occupational safety and health professionals committed to advancing members’ careers and the safety profession. Learn more at www.assp.org
JUNE 2023

VOL. 57 NO. 5